Protect priority species with targeted, per-turbine curtailment.
SkySentinel detects birds approaching your wind farm, tracks them in three dimensions and slows only the turbines they are heading for.
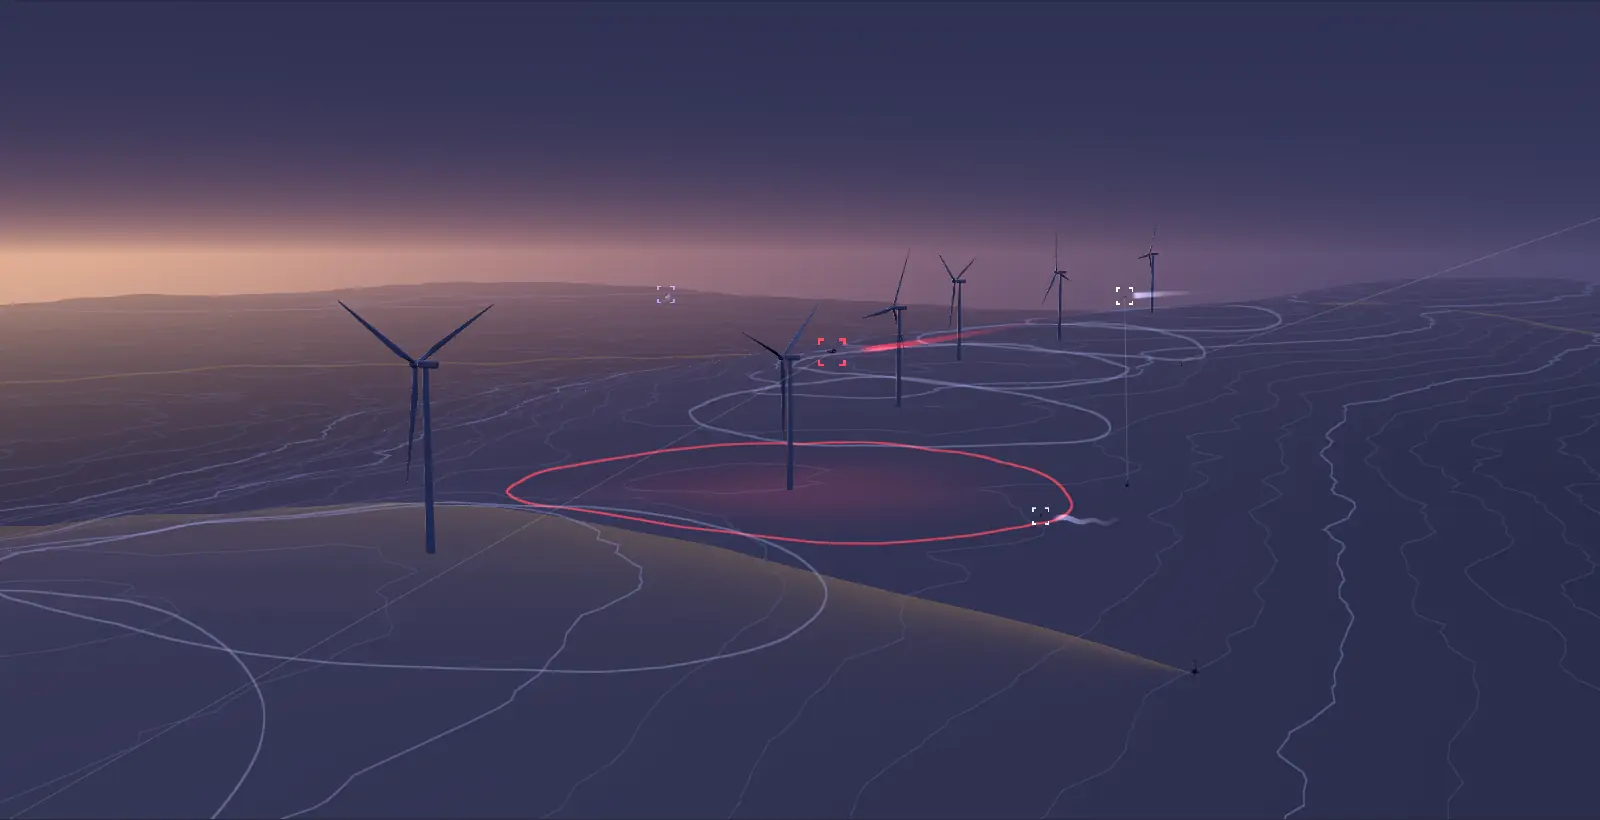
Animated 3D illustration of a wind farm on a ridge at dusk. A radar node detects every bird as an unidentified track. Camera nodes turn to each track and identify the species, shown in a small camera feed. When a priority species such as a Verreaux's Eagle heads for a turbine, that turbine slows to a stop, then returns to full speed once the bird has left. A Pied Crow, which is not a priority species, flies through another turbine's zone and that turbine keeps running.
Drag to look around the simulated site. Turbines turn red and slow down while a bird is in their zone.
Why radar and cameras together
Many wind farms in South Africa operate under environmental authorisations that require curtailment when priority species such as vultures and eagles are present. How well a system meets that depends on what it can see.
Camera-only systems lose birds in low light, haze and cloud. Radar-only systems see every target but can’t tell a vulture from a crow, so they curtail for anything they can’t identify, and lose generation to birds that were never at risk.
SkySentinel combines long-range radar with camera classification, the integrated approach called for in BirdLife South Africa’s Shutdown on Demand guidelines, and makes a measured decision for each turbine. You stay inside your permit conditions and keep generating everywhere else on site.
Camera only
0 of 9 slowed In low light, haze or cloud the bird isn’t seen, so the turbine in its path keeps turning.
Radar only
4 of 9 slowed It sees every target but can’t tell a vulture from a crow, so it curtails for anything unidentified.
SkySentinel
1 of 9 slowed Radar detects both birds and cameras identify them. Only the turbine in the vulture’s path slows.
Data that shapes the site, before you build
Deployed on mobile units during pre-construction monitoring, SkySentinel records bird flight paths and species, and bat activity and locations, around the proposed site, day and night, for as long as the campaign runs.
Instead of a few observer hours a week, you get a continuous, high-resolution record of avifaunal activity: the evidence that collision risk modelling and layout decisions need.
- Which species, how high, how often
- Flights are recorded with species, altitude, speed and heading, so you see which priority species use the site and at what heights.
- Paths and hotspots
- Flight paths, passage rates and heat maps by season and time of day show where activity concentrates across the proposed layout.
- Straight into collision risk modelling
- The data feeds directly into collision risk models, so turbine layout, micro-siting and mitigation rest on measured behaviour, not a few survey hours.
- One record, construction to operation
- Mobile units used for monitoring can move to final positions or become permanent masts, carrying the same data record into operational curtailment.
How it works
- 1
Detect
Radar nodes scan 360° around the site, day and night, picking up large birds up to 5 km out and tracking up to 100 targets at once.
- 2
Classify
The nearest camera node locks onto the radar track and our AI models identify the species.
- 3
Assess risk
For priority species, the flight path is projected against every turbine, and the risk is assessed from the bird’s movement and the site’s conditions. Other birds are logged, not acted on.
- 4
Curtail
Only the turbines in the bird’s path are curtailed, and only for as long as it is at risk.
- 5
Report
Every event is logged with imagery and flight data, ready for your environmental officer and the regulator.
What you get
- Per-turbine decisions
- A bird near one turbine stops that turbine, not the whole site. Everything else keeps generating.
- Only for species that matter
- Priority species and risk thresholds follow your EMPr and biodiversity management plan. Common birds don’t cost you energy.
- Day and night
- Radar runs 24/7 and can flag bat swarms at night. Cameras add species-level identification in daylight.
- Evidence you can hand over
- Imagery, 3D flight tracks and curtailment logs export as reports for audits, lenders and compliance.
On site
- Radar node. 360°, day and night.
- Camera nodes. Lock onto radar tracks and identify the species.
- Turbine link. A small communications device on the turbines nearest each node carries its data over the turbine fibre.
- Detection nodes
- FMCW radar with 360° coverage, running 24/7. Detects birds with a wingspan over 1.5 m up to 5 km away, tracks up to 100 targets at once, and picks up bat swarms at night.
- Classification nodes
- Long-range pan, tilt and zoom cameras that lock onto radar tracks and identify species, up to 2.5 km away in daylight.
- Placement
- Nodes stand 100–400 m from the turbines, on mobile trailers or permanent masts. Minimal communications devices are installed on a small subset of the turbines closest to each node, to carry its data over the turbine fibre backhaul. We plan positions with a 3D viewshed analysis of your site.
- Turbine interface
- Connects to your SCADA over the turbine fibre network using MQTT (TLS), OPC UA or Modbus TCP.
- Dashboard
- Live 2D and 3D map of every track, classifications with imagery, curtailment records and exportable reports.
See it on your site’s layout.
Send us your turbine coordinates and priority species. We will show you how SkySentinel would cover them.
Talk to us about SkySentinel